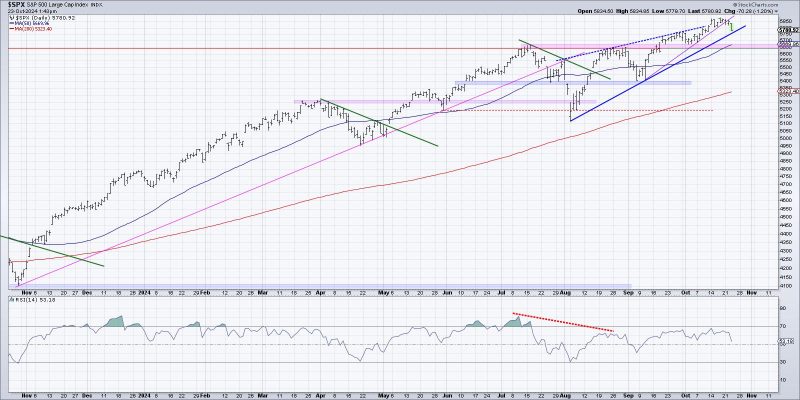
Unlocking the Power of Visualization for Identifying Distribution Phases
In the fast-paced world of investing and trading, identifying market phases is crucial for successfully navigating financial markets. One important phase that traders often look out for is the distribution phase, which can signal a potential change in market direction. Visualizing the start of a potential distribution phase can provide traders with valuable insights and help them make more informed decisions. Here are three ways to effectively visualize the start of a potential distribution phase:
1. Volume Analysis:
Volume analysis is a powerful tool that can provide valuable clues about the strength of a market move. In the context of identifying a potential distribution phase, a decrease in trading volume can be a key indicator. As a distribution phase begins, the volume of trades may start to taper off, indicating that buying interest is waning and that sellers are starting to dominate the market.
By plotting volume data alongside price movements, traders can visualize the relationship between trading activity and market movements. A sharp decline in volume during a price rally may suggest that the market is running out of steam and that a distribution phase could be on the horizon. Monitoring volume trends can help traders anticipate potential market reversals and adjust their trading strategies accordingly.
2. Technical Indicators:
Technical indicators are commonly used by traders to analyze market trends and identify potential trading opportunities. When it comes to visualizing the start of a potential distribution phase, certain technical indicators can be particularly useful. For example, the Relative Strength Index (RSI) and the Moving Average Convergence Divergence (MACD) can help traders spot signs of weakening buying pressure and potential distribution.
A divergence between price movements and technical indicators, such as the RSI or MACD, can be a strong signal that a distribution phase is underway. For instance, if prices continue to rise while the RSI shows a downward trend, it may indicate that the market is becoming overbought and that a distribution phase could be imminent. Traders can leverage these technical indicators to confirm their analysis and make more informed trading decisions.
3. Chart Patterns:
Chart patterns can provide valuable insights into market dynamics and help traders anticipate potential price movements. When analyzing the start of a potential distribution phase, certain chart patterns, such as head and shoulders patterns, double tops, or rising wedges, can be particularly relevant. These patterns often indicate a shift in market sentiment and can signal the beginning of a distribution phase.
By identifying and analyzing these chart patterns, traders can visualize the evolving market structure and anticipate potential price reversals. For instance, a head and shoulders pattern forming at the peak of an uptrend may suggest that a distribution phase is taking shape, with sellers gaining control over the market. Traders who can effectively recognize these patterns can position themselves to capitalize on potential market reversals and protect their capital.
In conclusion, visualizing the start of a potential distribution phase is essential for traders looking to maximize their trading performance and navigate changing market conditions effectively. By leveraging volume analysis, technical indicators, and chart patterns, traders can gain valuable insights into market dynamics and make more informed trading decisions. Understanding the early signs of a distribution phase can give traders a competitive edge in the financial markets and help them stay ahead of the curve.
