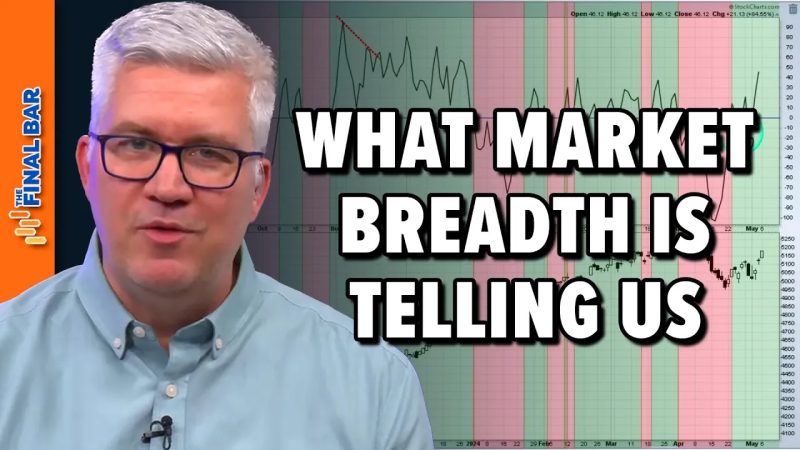
Market Breadth Indicator – The Key to Understanding Market Dynamics
The stock market is a complex ecosystem where a multitude of factors and variables interact to determine the direction of stock prices. While most investors are familiar with traditional indicators such as moving averages, volume, and relative strength index (RSI), there is one crucial indicator that often goes unnoticed – the market breadth indicator.
Market breadth refers to the balance between advancing and declining stocks in the market. In simple terms, it measures the level of participation and strength of the market rally or decline. This indicator can provide valuable insight into the health of the market and help investors make more informed trading decisions.
Understanding market breadth is essential because it reflects the underlying strength or weakness of the market. When the market is advancing but only a small number of stocks are participating in the rally, it may indicate that the market is being driven by a few large-cap stocks, rather than widespread market strength. On the other hand, a broad-based rally where a large number of stocks are advancing suggests a healthier and more sustainable market uptrend.
One popular market breadth indicator is the Advance-Decline Line (AD Line), which tracks the number of advancing stocks minus the number of declining stocks on a daily basis. A rising AD Line indicates that more stocks are advancing than declining, signaling broad market strength. Conversely, a declining AD Line suggests weakening market breadth, which could be a warning sign of a potential market reversal.
Another important market breadth indicator is the Advance-Decline Ratio, which compares the number of advancing stocks to the number of declining stocks on a given day. A ratio greater than 1 indicates positive market breadth, while a ratio less than 1 indicates negative breadth. By monitoring the Advance-Decline Ratio, investors can gauge the intensity and sustainability of a market trend.
In addition to the AD Line and Advance-Decline Ratio, investors can also utilize other market breadth indicators such as the McClellan Oscillator, the Arms Index (TRIN), and the McClellan Summation Index to gain a comprehensive view of market breadth dynamics.
In conclusion, market breadth indicators are essential tools for investors to comprehend the underlying market dynamics and identify potential opportunities or risks in the stock market. By paying attention to market breadth, investors can better navigate the complexities of the market and make more informed investment decisions. Remember, a healthy market rally is characterized by strong market breadth, where a large number of stocks are participating in the upward movement. Keep an eye on market breadth indicators to stay ahead of market trends and secure your financial success.

