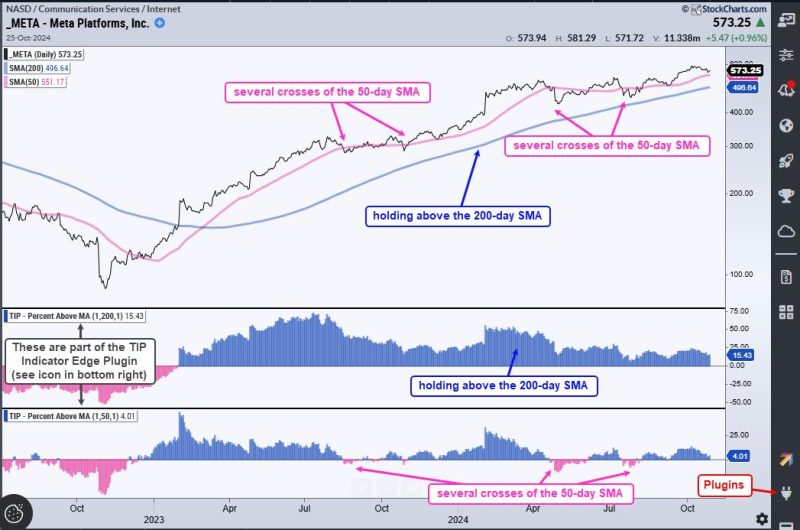
Indicators play a crucial role in helping traders gain an edge in the financial markets. By incorporating the right indicators into your analysis, you can make more informed decisions and improve the overall performance of your trading strategy. In this article, we will discuss two key indicators that can significantly enhance your edge in trading.
Moving Average Convergence Divergence (MACD)
One of the most popular indicators used by traders is the Moving Average Convergence Divergence (MACD). This indicator consists of two moving averages – the MACD line and the signal line. The MACD line is calculated by subtracting the 26-period exponential moving average (EMA) from the 12-period EMA, while the signal line is a 9-period EMA of the MACD line.
Traders use the MACD to identify potential trend reversals and momentum shifts in the market. When the MACD line crosses above the signal line, it is considered a bullish signal, indicating that the price may continue to rise. Conversely, when the MACD line crosses below the signal line, it is a bearish sign that suggests a potential downturn in prices.
By paying attention to the crossovers of the MACD and signal lines, traders can anticipate changes in market direction and adjust their trading strategy accordingly. Additionally, the MACD histogram, which represents the difference between the MACD and signal lines, can provide further insights into market momentum.
Relative Strength Index (RSI)
Another important indicator that traders use to improve their edge is the Relative Strength Index (RSI). The RSI is a momentum oscillator that measures the speed and change of price movements. It ranges from 0 to 100 and is typically used to identify overbought or oversold conditions in the market.
When the RSI crosses above 70, it indicates that the market is overbought, suggesting that prices may be due for a correction. Conversely, when the RSI falls below 30, it signals that the market is oversold, and prices could potentially rebound.
Traders can use the RSI to confirm potential trend reversals or filter out false signals generated by other indicators. By incorporating the RSI into their analysis, traders can enhance their ability to time their entries and exits more effectively and capitalize on profitable trading opportunities.
In conclusion, by utilizing key indicators such as the MACD and RSI, traders can gain a significant edge in the financial markets. These indicators help traders identify potential trend reversals, gauge market momentum, and pinpoint overbought or oversold conditions. By incorporating these indicators into their trading strategy, traders can make more informed decisions and improve their overall trading performance.

