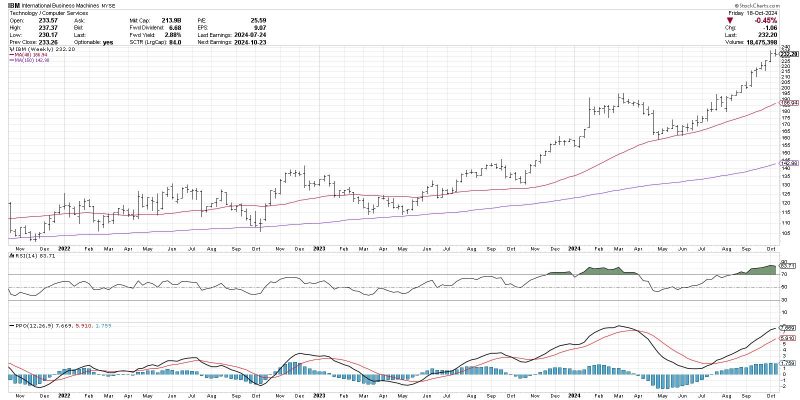
Unveiling the Power of the MACD Histogram in Predicting Trend Shifts
The MACD Histogram: A Powerful Tool for Anticipating Trend Changes
MACD (Moving Average Convergence Divergence) is a popular technical analysis tool used by traders to identify potential trends and reversal points in the market. While the standard MACD line and signal line are commonly used for this purpose, the MACD Histogram offers a more detailed look at the relationship between these lines, providing valuable insights for anticipating trend changes.
The MACD Histogram is derived from the standard MACD line, which is calculated by subtracting the 26-period Exponential Moving Average (EMA) from the 12-period EMA. The signal line, a 9-period EMA of the MACD line, helps identify potential buy and sell signals.
The MACD Histogram, on the other hand, represents the difference between the MACD line and the signal line. It is plotted as a histogram, with bars that oscillate above and below the zero line. Positive values indicate that the MACD line is above the signal line, suggesting bullish momentum, while negative values signify a bearish trend.
One of the key advantages of using the MACD Histogram is its ability to provide early signals of potential trend changes. When the histogram bars start to decrease in size after a significant upswing, it could indicate a weakening bullish trend and a possible reversal. Conversely, a decrease in bar size following a prolonged downtrend may suggest a weakening bearish trend and a potential trend reversal to the upside.
Moreover, divergences between the MACD Histogram and price action can also signal upcoming trend changes. Bullish divergence occurs when the price makes lower lows while the MACD Histogram forms higher lows, indicating a potential bullish reversal. On the other hand, bearish divergence is observed when the price forms higher highs while the MACD Histogram shows lower highs, signaling a potential bearish reversal.
Additionally, traders can use the MACD Histogram to confirm trend continuations. A series of increasing histogram bars above the zero line during an uptrend or below the zero line in a downtrend suggests strong momentum in the respective direction. Conversely, decreasing histogram bars may indicate weakening momentum and an upcoming trend reversal.
In conclusion, the MACD Histogram is a powerful tool that can help traders anticipate trend changes and confirm market trends. By analyzing the relationship between the MACD line and the signal line through the histogram bars, traders can gain valuable insights into potential buy and sell signals, as well as identify early warnings of trend reversals. When used in conjunction with other technical indicators and price analysis, the MACD Histogram can enhance trading strategies and improve overall decision-making in the dynamic world of financial markets.
