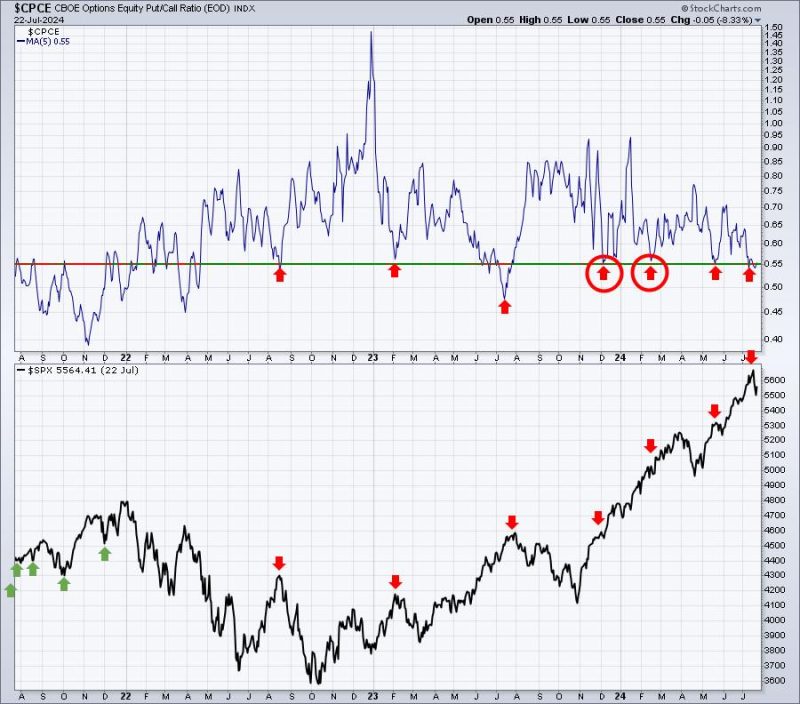
In the world of finance and investment, identifying market bottoms can be a challenging yet crucial task. Timing the market correctly can lead to significant profits, making it essential for investors to keep a close eye on various indicators and charts. In this article, we will explore three key charts that investors should watch to determine if we have reached a market bottom.
Chart 1: Stock Market Indexes
One of the primary indicators to observe when trying to determine a market bottom is the behavior of stock market indexes. Indexes such as the S&P 500, Dow Jones Industrial Average, and Nasdaq Composite can provide valuable insights into the overall sentiment of investors. In a downtrend, these indexes may experience sharp declines and volatility. Watching for signs of stabilization, such as a series of higher lows or a decrease in trading volume during declines, can indicate a potential market bottom.
Chart 2: Volatility Index (VIX)
The Volatility Index, also known as the VIX, is a key measure of market volatility and investor fear. During periods of market uncertainty or downturns, the VIX tends to spike as investors rush to buy options for protection. Monitoring the VIX can help investors gauge market sentiment and potential turning points. A VIX at extremely high levels may indicate excessive fear in the market, potentially signaling a bottom as panic selling reaches its peak.
Chart 3: Breadth Indicators
Breadth indicators such as the Advance-Decline Line and New Highs-New Lows can offer valuable insights into the underlying strength or weakness of the market. A healthy market typically sees broad participation across various sectors and individual stocks. However, during market corrections or bottoms, the breadth of the market may deteriorate as fewer stocks participate in the rally attempts. Tracking these breadth indicators can provide early signals of potential market bottoms as investors look for signs of improving market breadth.
Putting It All Together
While no single chart or indicator can provide a definitive answer to whether we have reached a market bottom, combining insights from multiple indicators can help investors make more informed decisions. By monitoring stock market indexes for signs of stabilization, tracking the VIX for shifts in market sentiment, and analyzing breadth indicators for the overall market strength, investors can better position themselves to capitalize on potential market rebounds.
In conclusion, identifying market bottoms is a complex and ongoing process that requires a combination of technical analysis, market knowledge, and a keen understanding of investor psychology. By keeping a close eye on key indicators and charts, investors can improve their decision-making process and potentially capitalize on market opportunities.

