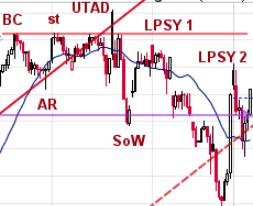
Wyckoff at Work in the Intraday Timeframe
Intraday trading can be both exhilarating and overwhelming, with fast-paced price action and rapid decision-making being key components. The Wyckoff method, developed by renowned trader Richard D. Wyckoff, offers a strategic approach to analyzing and interpreting price movements in the stock market. By applying Wyckoff principles to the intraday timeframe, traders can enhance their understanding of market dynamics and make more informed trading decisions.
Accumulation and distribution are two fundamental phases in the Wyckoff method. During accumulation, smart money entities strategically accumulate positions before causing a price markup. Intraday traders can identify accumulation patterns such as higher lows and increasing volume, signaling potential upward momentum. Conversely, distribution occurs when smart money entities distribute their holdings to uninformed traders, leading to a price markdown. Intraday traders can spot distribution patterns like lower highs and decreasing volume, indicating a possible downtrend.
Volume analysis is a critical component of the Wyckoff method in the intraday timeframe. Volume provides valuable insights into the strength or weakness of a price movement. For instance, high volume during a price rally suggests strong buying interest and potential continuation of the uptrend. Conversely, declining volume amid a price increase could indicate waning momentum and a possible reversal. By closely monitoring volume patterns, intraday traders can gauge the conviction behind price movements and adjust their strategies accordingly.
The concept of support and resistance plays a pivotal role in the Wyckoff method for intraday trading. Support levels represent areas where buying interest is strong enough to prevent prices from declining further. Intraday traders can identify support levels based on previous price action and volume clusters. When price approaches a support level and shows signs of accumulation, it may present a buying opportunity for intraday traders looking to capitalize on a potential price rebound.
Conversely, resistance levels signify areas where selling pressure outweighs buying interest, causing prices to stall or reverse. Intraday traders can pinpoint resistance zones by analyzing previous price peaks and volume spikes. When price encounters a resistance level and exhibits distribution characteristics, intraday traders may consider shorting the asset in anticipation of a price decline.
Intraday traders utilizing the Wyckoff method should also pay attention to price spread and closing behavior. Price spread refers to the difference between the high and low prices of a trading session, indicating the volatility and range of price movements. A narrow price spread suggests low volatility and potential consolidation, while a wide price spread indicates heightened volatility and possible trend continuation.
Furthermore, analyzing closing behavior can help intraday traders assess market sentiment and potential trend reversals. A strong closing near the high of the session signals bullish momentum and a potential uptrend continuation, whereas a weak closing near the low of the session suggests bearish sentiment and a possible downtrend continuation. By incorporating price spread and closing behavior analysis into their intraday trading strategy, traders can gain a better understanding of market dynamics and refine their decision-making process.
In conclusion, applying the Wyckoff method in the intraday timeframe can provide intraday traders with a systematic approach to analyzing price movements, volume patterns, support and resistance levels, price spread, and closing behavior. By understanding the fundamental principles of accumulation, distribution, volume analysis, and market structure, intraday traders can enhance their trading skills and effectively navigate the fast-paced and dynamic intraday market environment.

