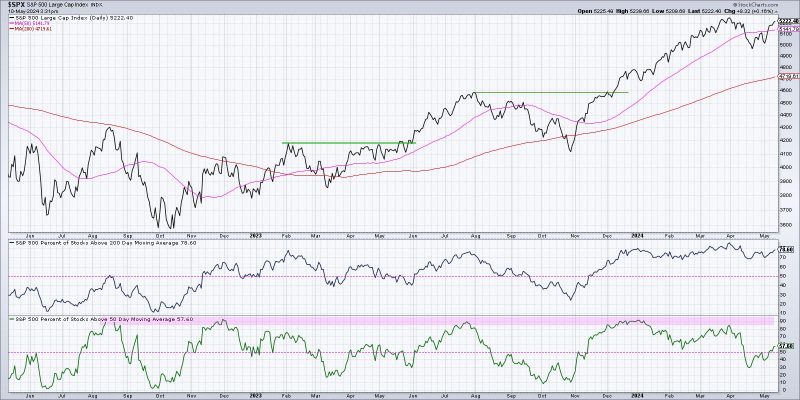
Unlocking Market Success: 3 Key Breadth Indicators for a Strong Bull Run
Breadth indicators are essential tools in technical analysis that help traders and investors gauge the overall health and direction of the market. By analyzing the breadth of the market, traders can confirm the strength of a trend and make more informed trading decisions. In this article, we will discuss three breadth indicators that can be used to confirm a bullish market trend.
1. Advance-Decline Line (AD Line):
The Advance-Decline Line is a breadth indicator that measures the number of advancing stocks minus the number of declining stocks on a particular exchange. A rising AD Line indicates that more stocks are advancing than declining, suggesting broad market strength and confirming a bullish trend. Conversely, a declining AD Line may signal internal weakness in the market and a potential reversal of the bullish trend.
Traders can use the AD Line to confirm the strength of a market rally. If the AD Line is trending higher along with the price of the market index, it validates the bullish trend. On the other hand, if the AD Line is diverging from the price trend, it may indicate a lack of participation from a broad range of stocks and a weakening bullish trend.
2. New Highs-New Lows (NH-NL) Indicator:
The New Highs-New Lows Indicator compares the number of stocks hitting new highs versus the number of stocks hitting new lows over a specific period. In a healthy bullish market, the number of stocks making new highs should exceed the number of stocks making new lows, indicating broad participation in the market rally.
When the NH-NL Indicator is trending higher, it confirms the strength of the bullish trend as more stocks are participating in the advance. However, if the NH-NL Indicator starts to decline while the market index continues to rise, it may suggest a lack of participation from a broad range of stocks, potentially signaling a weakening bullish trend.
3. McClellan Oscillator:
The McClellan Oscillator is a breadth indicator that measures the difference between the number of advancing and declining issues on an exchange over a specific period. The oscillator oscillates around a zero line, with positive values indicating more advancing stocks and negative values indicating more declining stocks.
A rising McClellan Oscillator suggests that more stocks are advancing than declining, confirming a bullish market trend. Traders can use the oscillator to identify overbought and oversold conditions in the market. When the oscillator reaches extreme levels, it may indicate that the market is due for a reversal or a pullback.
In conclusion, breadth indicators play a crucial role in confirming the strength of a bullish market trend. By analyzing indicators such as the Advance-Decline Line, New Highs-New Lows Indicator, and McClellan Oscillator, traders can assess the breadth of market participation and make more informed trading decisions. Understanding these breadth indicators can help traders navigate volatile market conditions and improve their chances of success in the market.
